When your campaign is live, your ad is shown to the targeted audiences. Statistics how many times your ads are shown (impressions), clicks, views, completions, etc. are collected daily.
In the campaign list you can see your original Budget, Amount delivered, Quantity, Impressions, Clicks and CTR (click-through-rate).

The daily statistics are calculated into Performance charts which are updated continuously.
Statistics are collected from creative level all the way up to totals for all your campaigns.
Performance summary
On your Dashboard > Performance summery you get an overview of total statistics for all your campaigns.
Total Impressions
How many times your ads have been shown.
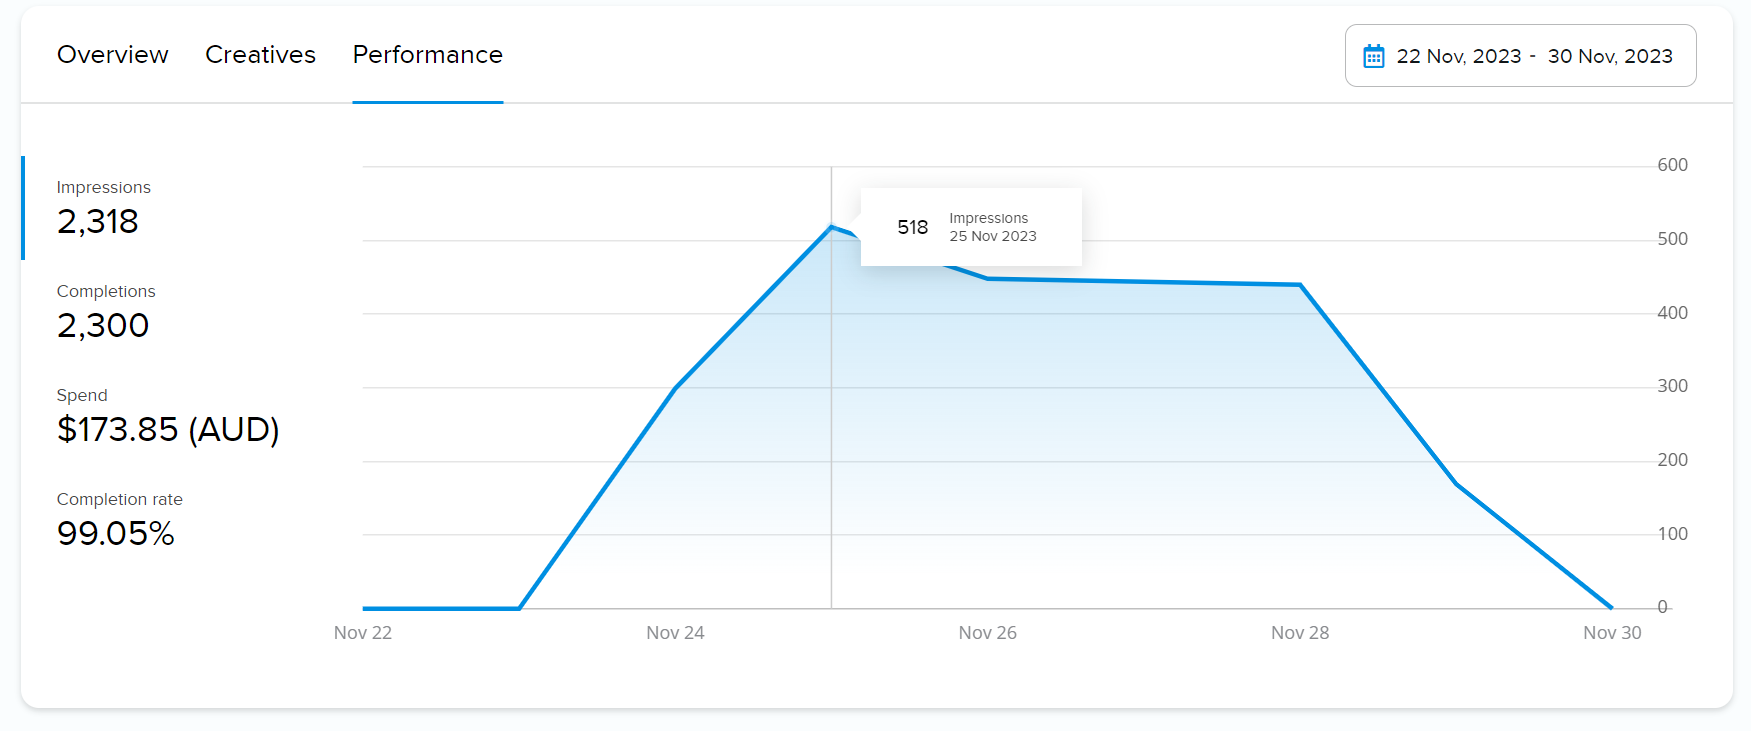
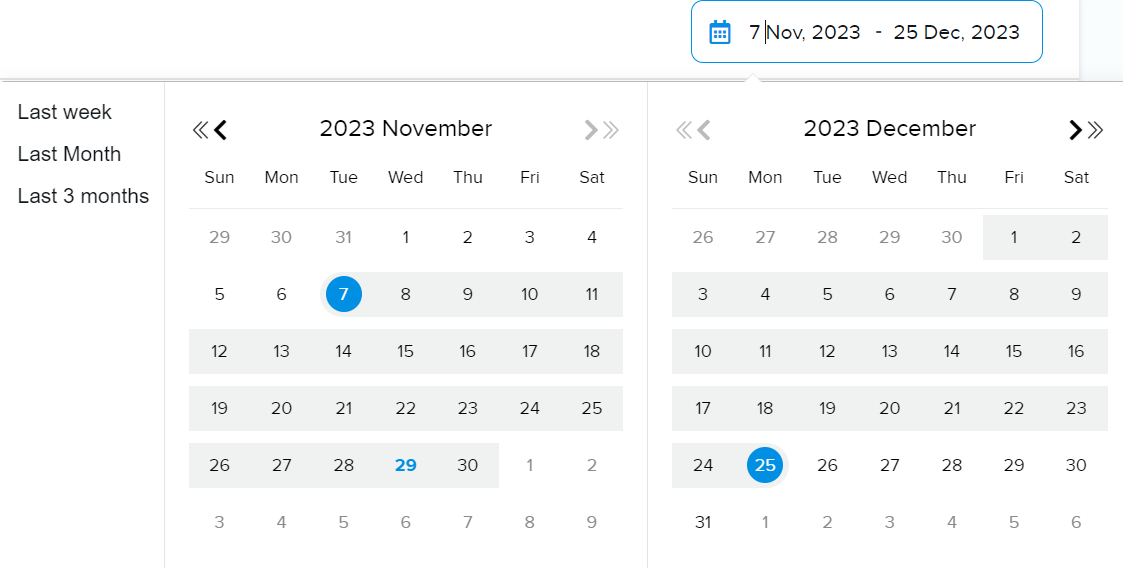
You can filter the chart on Start and End dates.
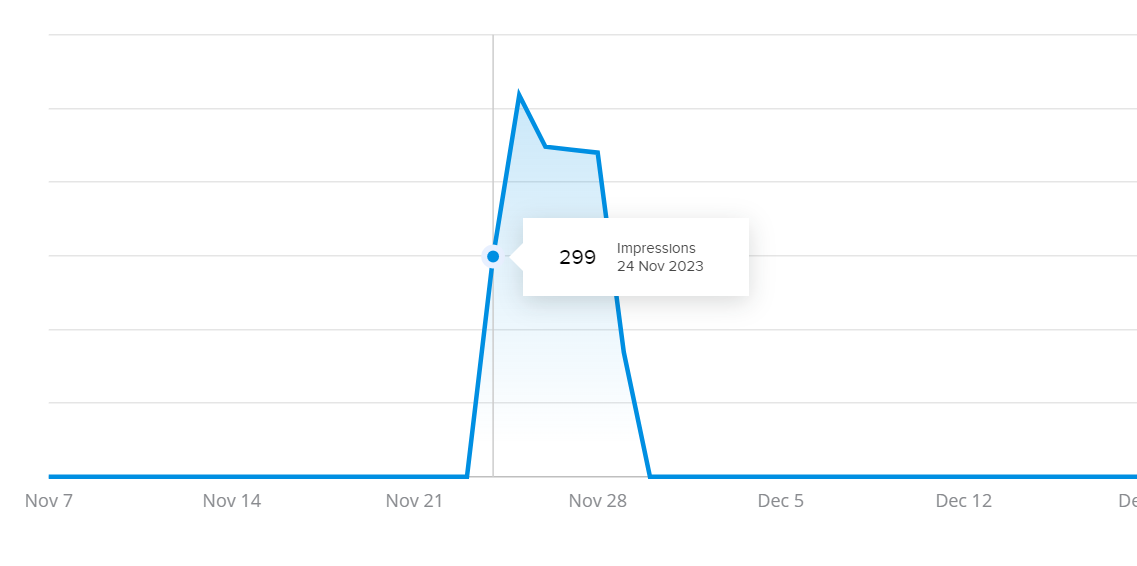
If you move your mouse over the chart you can see more details.
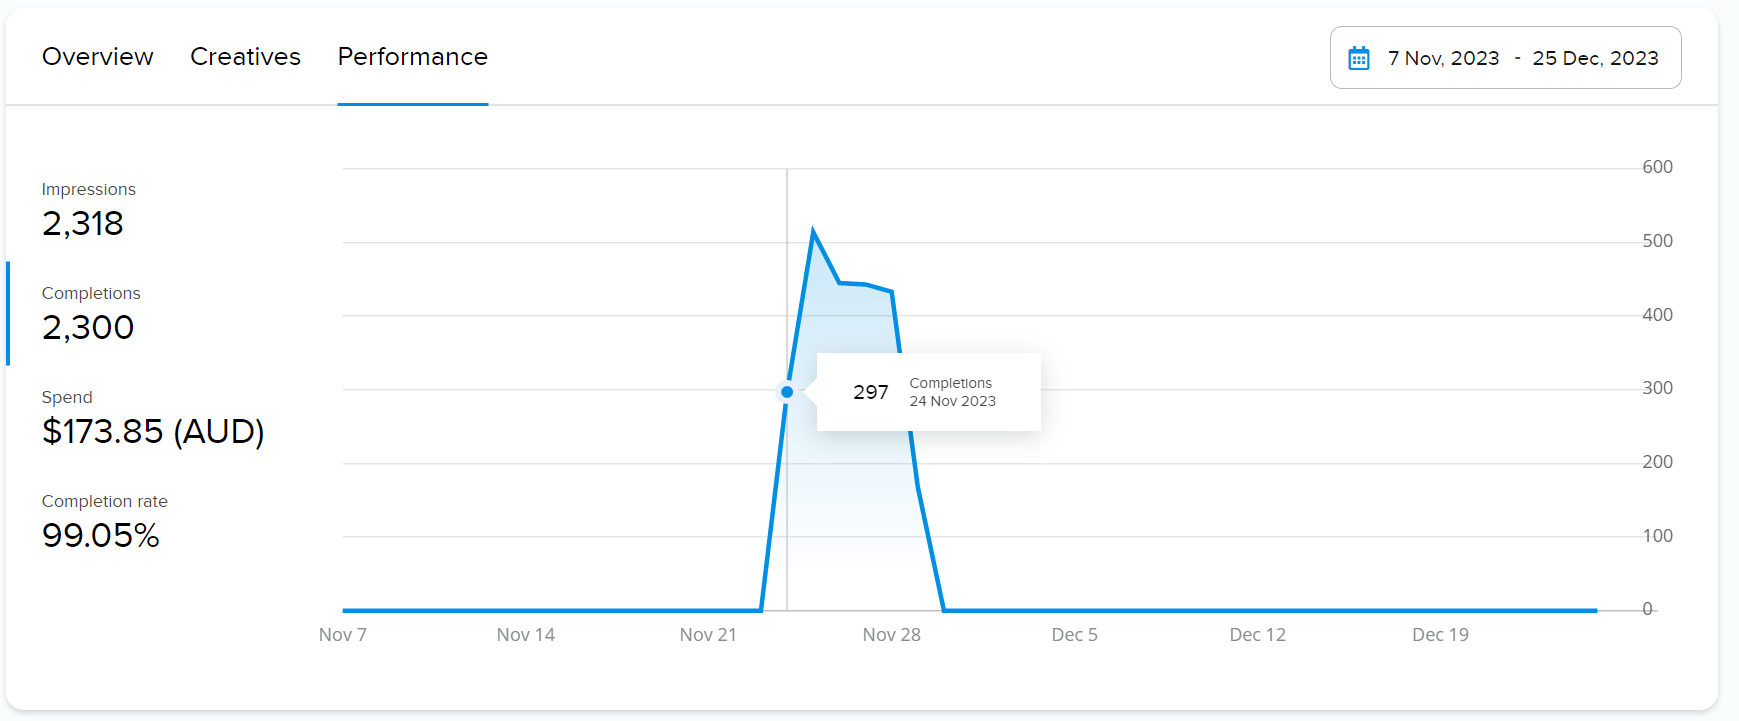
Total Completions
Number of times people have viewed your ad from beginning to end.
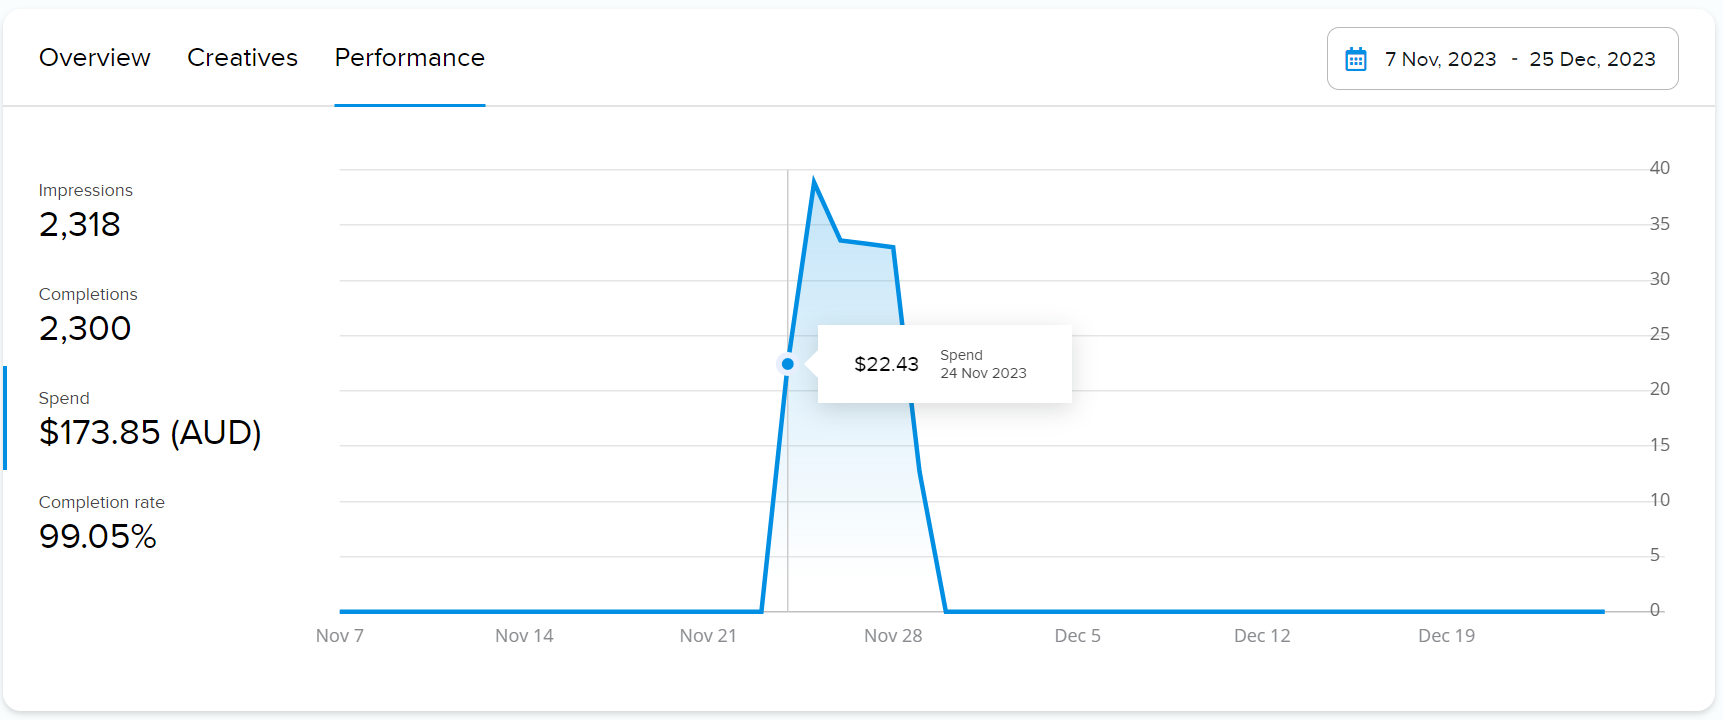
Total Spend
Total amount spend so far during your campaign.
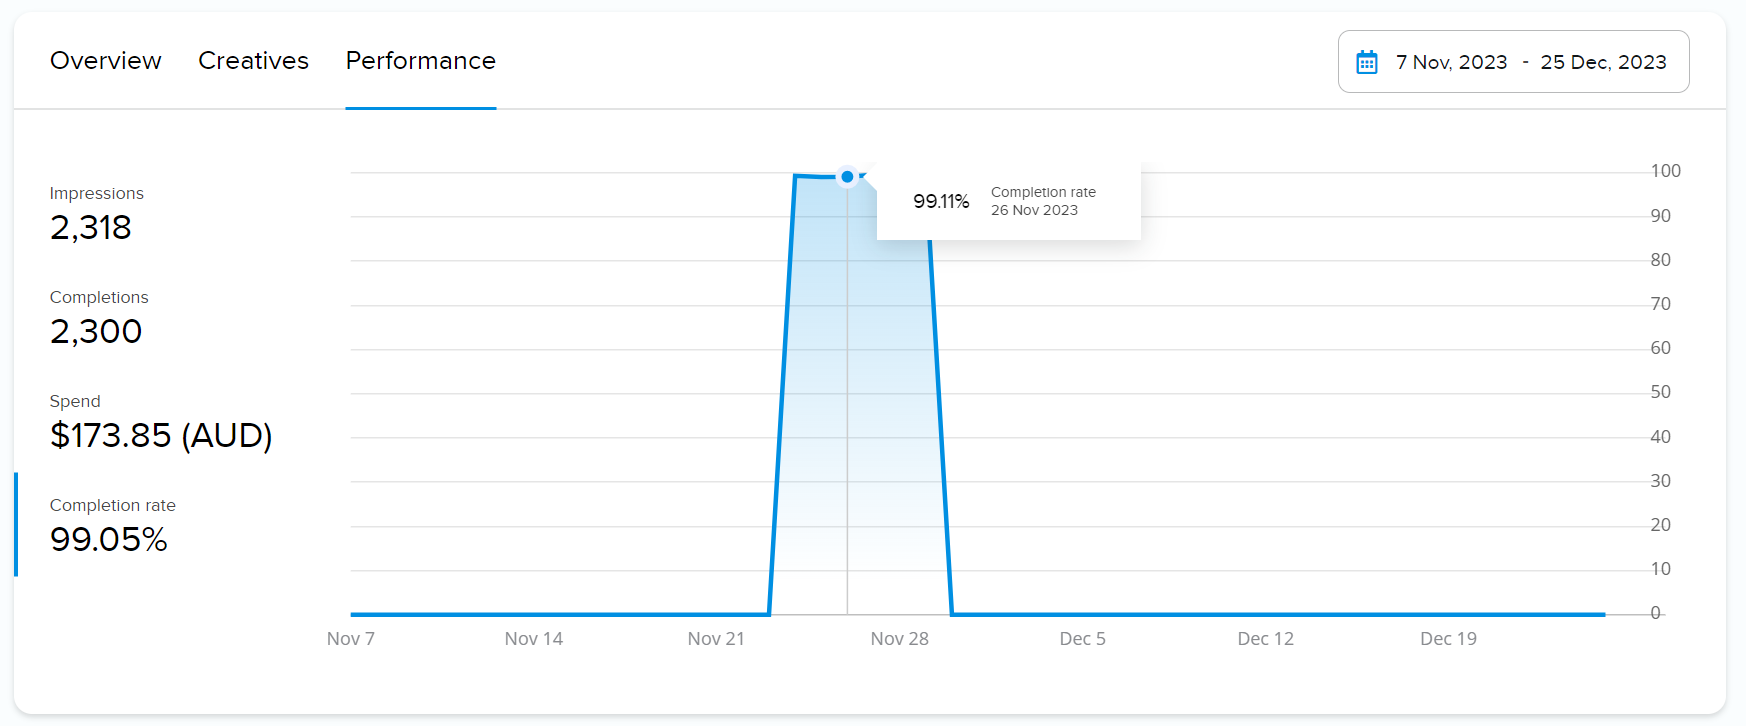
Completion rate
The percentage of people who watch your video ads to their completion.
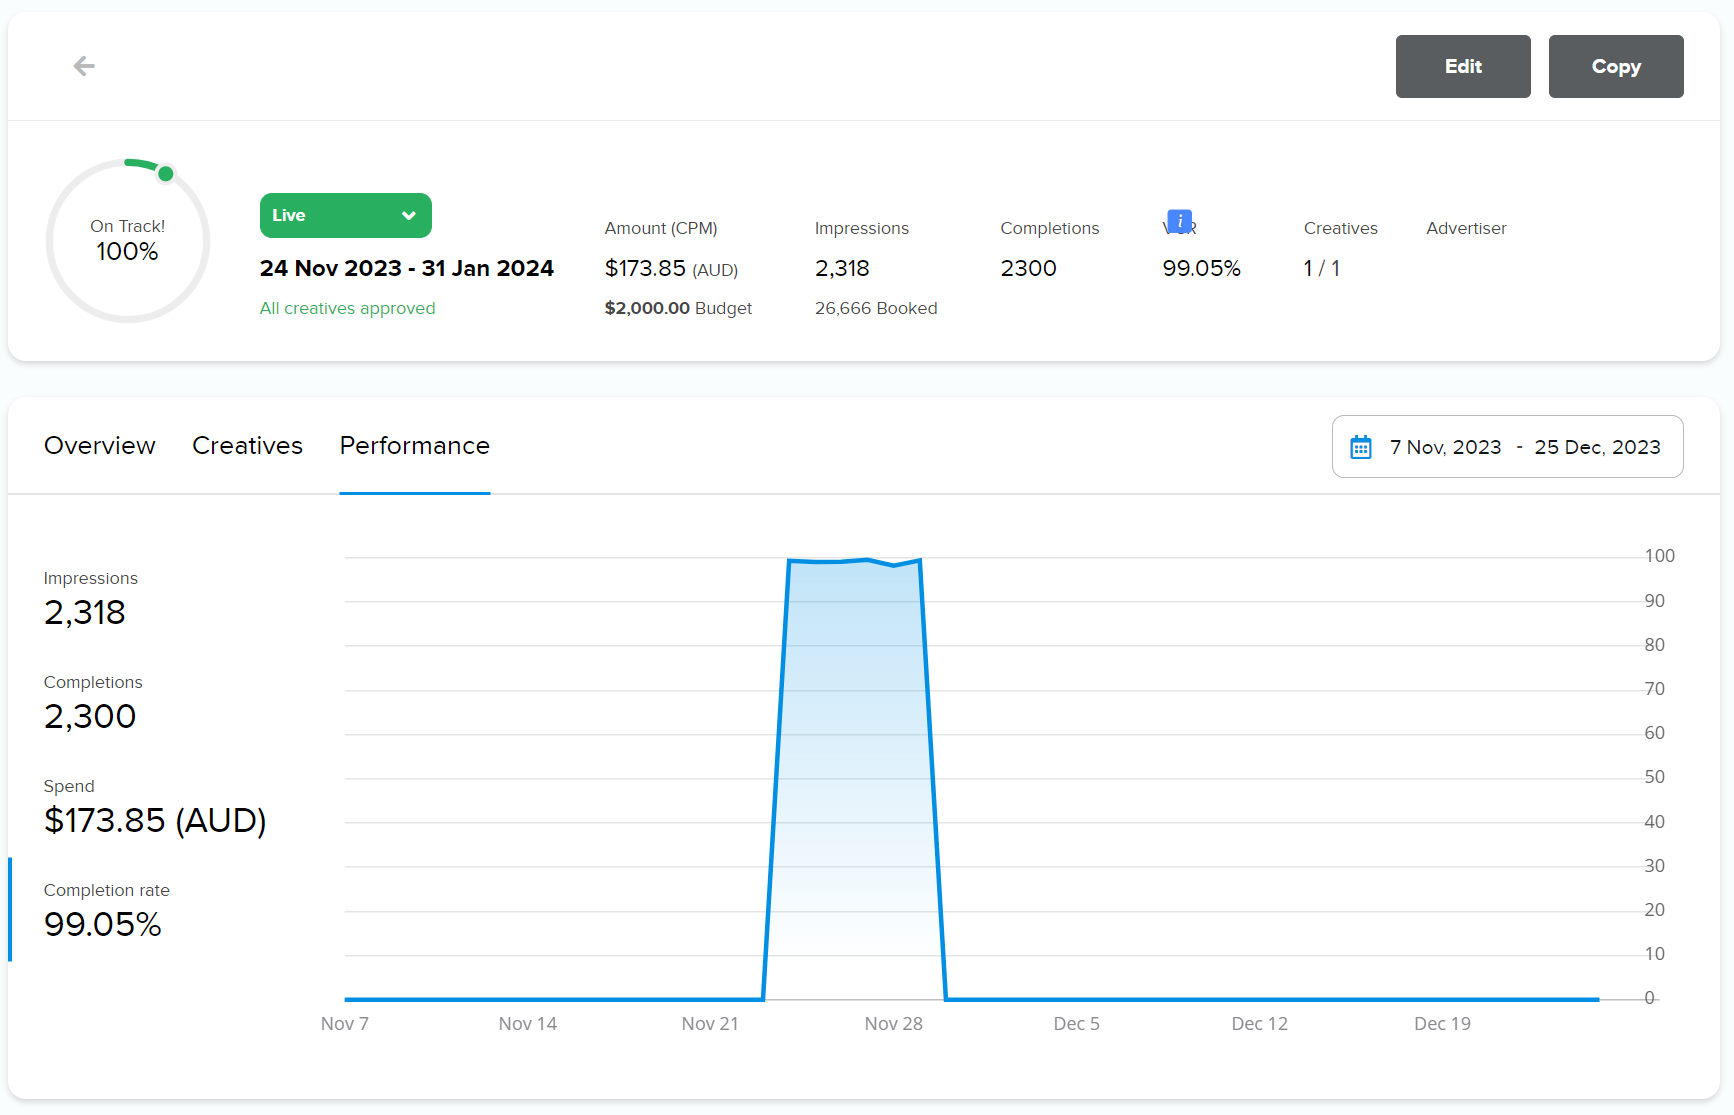
Campaign performance
On Campaign details > Performance you find the statistics for each campaign.